Feature Gallery

Nine operational views beyond standard resource browsing.

The original Kubernetes Dashboard showed you resources. These nine pages let you act on what you find — security posture, live events, certificate health, resource waste, network topology, and more. All built natively into the dashboard, no extra tools required.

9 Operational Views
0 Extra Tools Required
Live Real-Time Data
RBAC Permission-Aware
Application Projects — per-namespace cards with pod health and resource totals
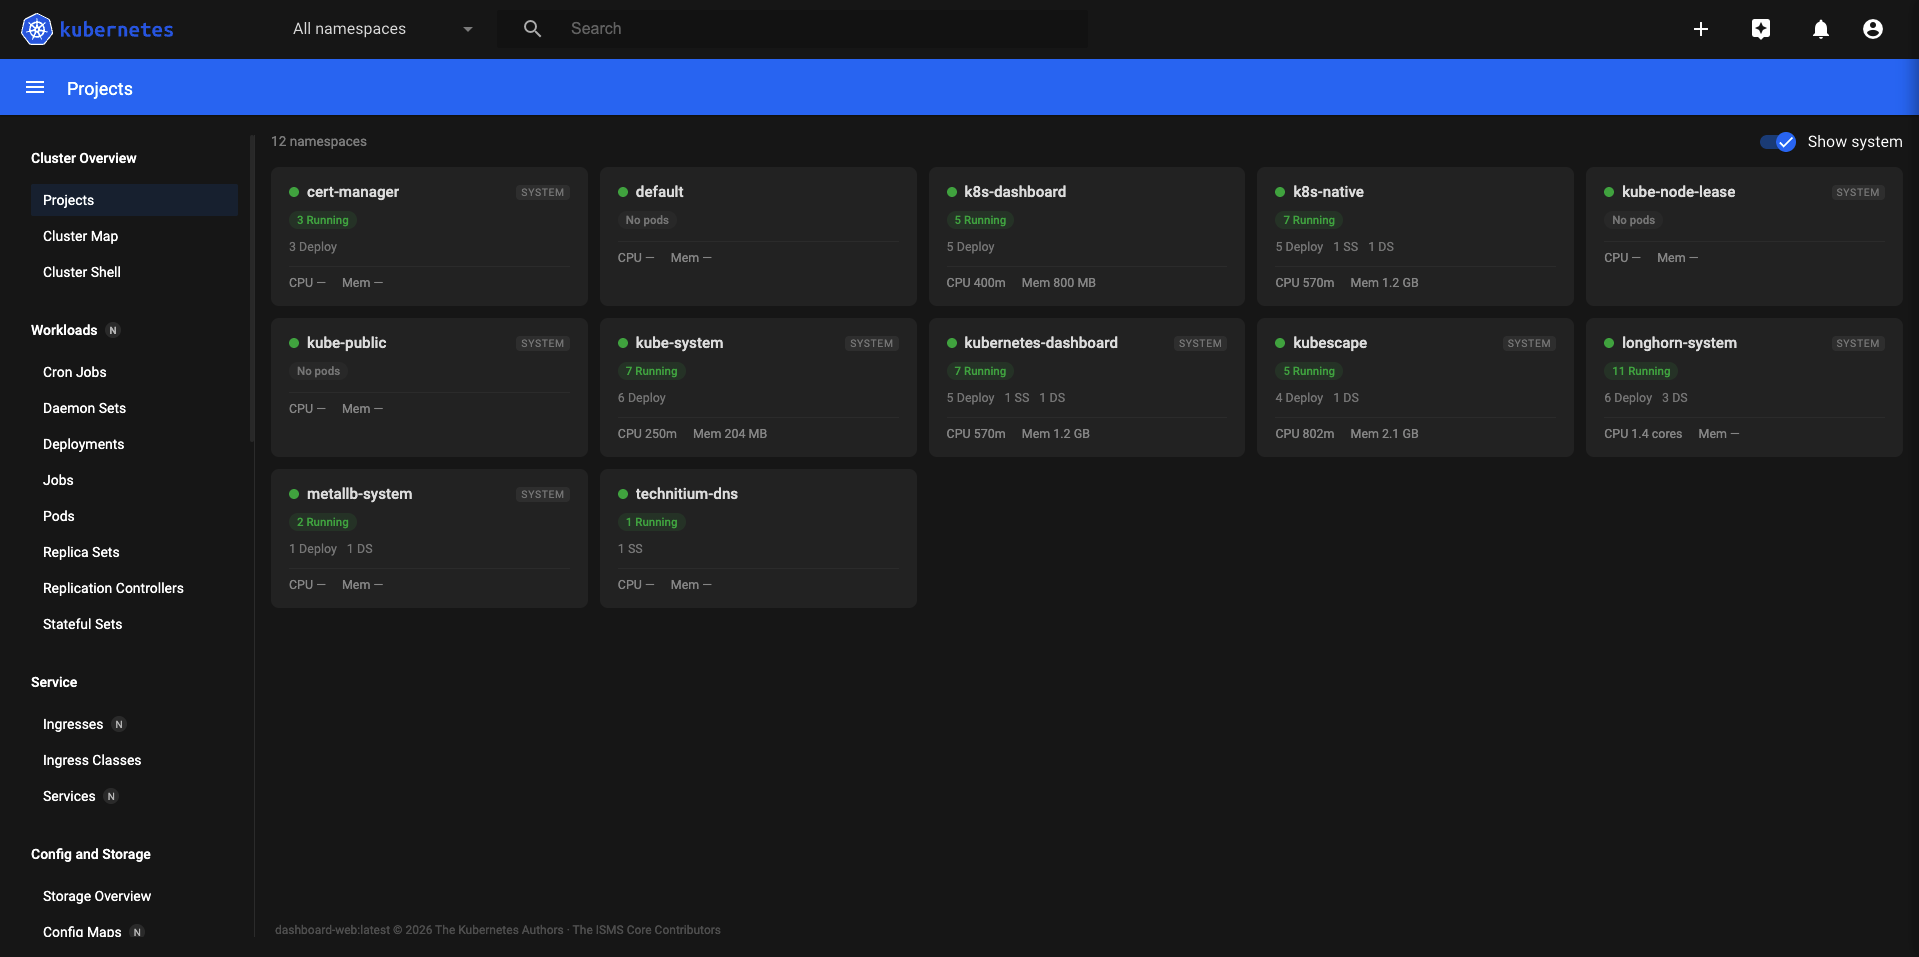
Application Projects — namespace-scoped project cards
Application Projects

Namespaces as Projects

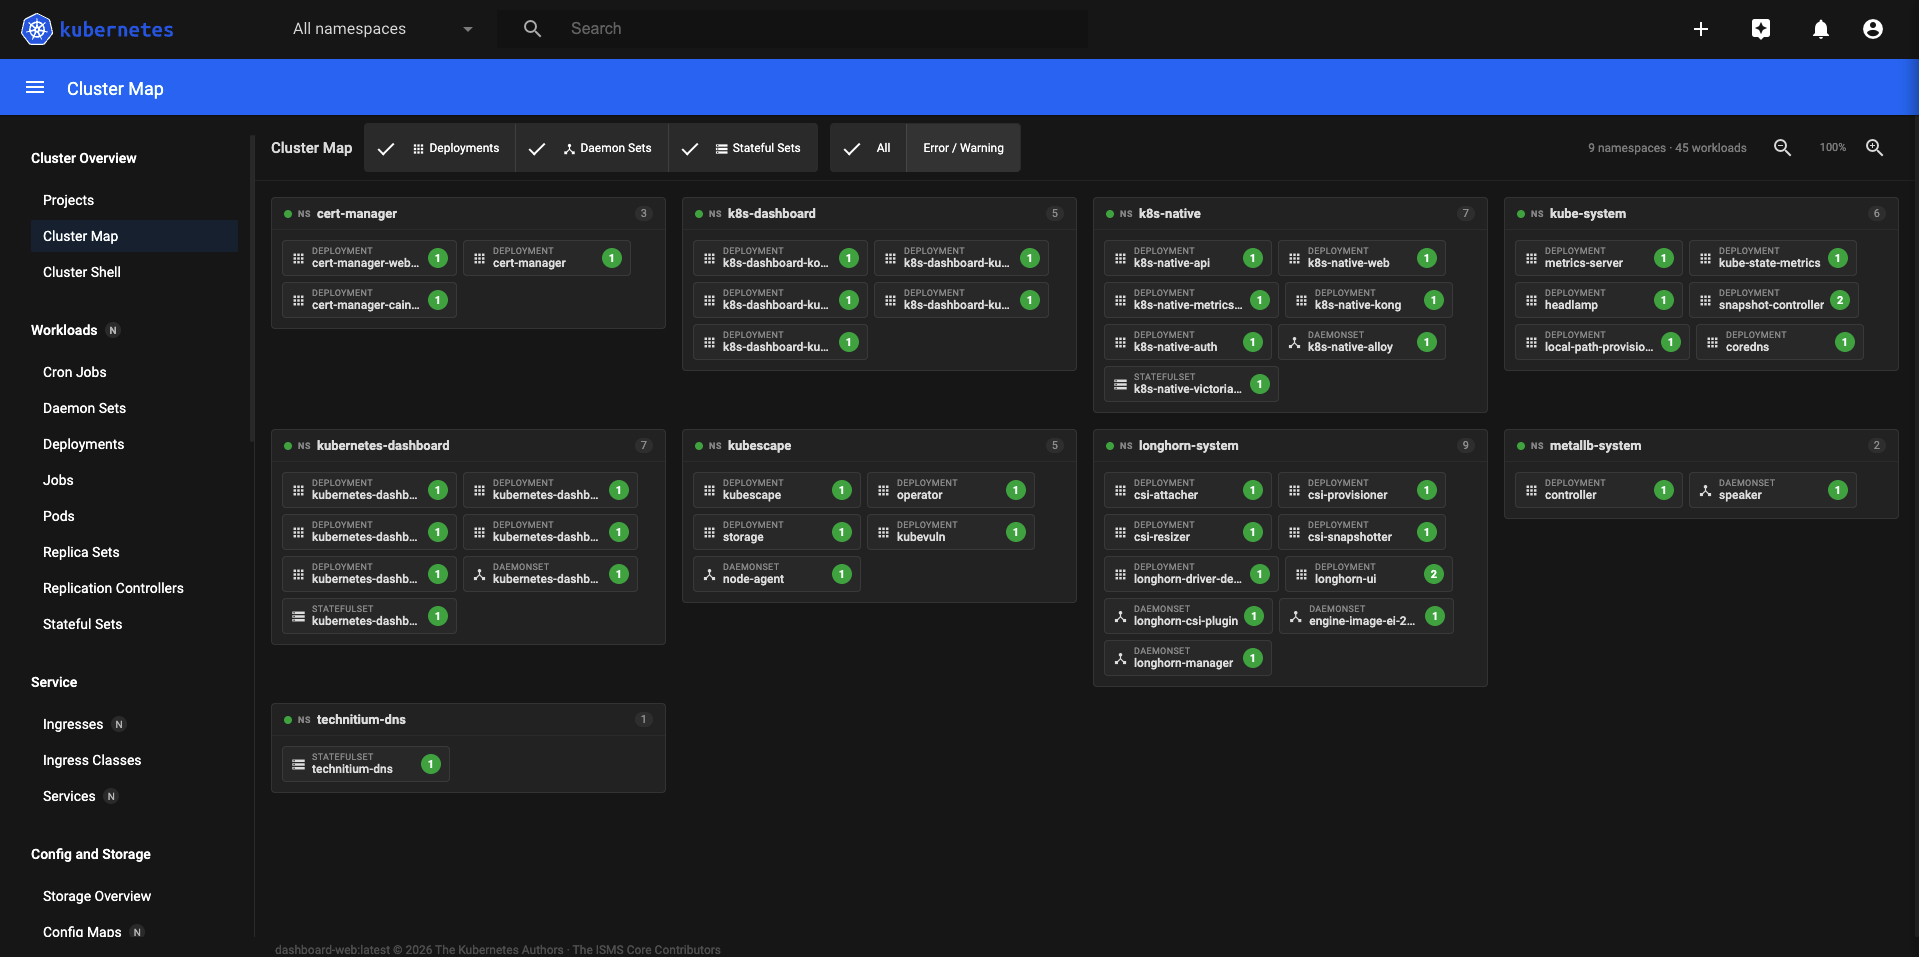
Treats each namespace as a self-contained application project. A card-per-namespace view that summarises workload health, pod counts, CPU and memory totals, and deployment status at a glance — without opening individual resource pages.

  • Pod health summary per namespace: Running, Pending, Failed counts
  • Aggregate CPU and memory request totals
  • Deployment and StatefulSet status rolled up per project
  • Click-through to the namespace's workloads directly
  • Useful for multi-tenant clusters where namespaces map to teams or applications
Cluster Map — namespace-scoped topology with health filter and zoom
Cluster Map — topology view with health overlay
Cluster Map

Visual Cluster Topology

A zoomable, filterable topology view of all namespaces and their workloads. Cards are colour-coded by health state so problem areas stand out immediately. Useful for getting an instant read of cluster state without scanning through lists.

  • Namespace cards with nested workload cards inside each
  • Health filter: show All, Errors only, or Warnings only
  • Colour-coded status: green (healthy), amber (degraded), red (failed)
  • Zoom and pan across large clusters
  • Click any workload card to jump to its detail page
Policy Audit — Polaris security scoring per workload
Policy Audit — Polaris security scoring
Policy Audit

Security Scoring per Workload

Runs 14 Polaris security checks against every workload in the cluster and produces a 0–100 score per workload. Fails are expandable to show which specific check failed and why — giving actionable guidance, not just a red light.

  • 14 Polaris checks: readiness probes, resource limits, security context, privilege escalation, and more
  • Score 0–100 per workload — sortable table
  • Expandable row shows each check result with pass/warn/fail status
  • Covers Deployments, DaemonSets, StatefulSets, Jobs, and CronJobs
  • No Polaris operator required — checks run against the API server directly
Resource Efficiency — CPU and memory request vs limit vs actual usage
Resource Efficiency — request vs limit vs actual
Resource Efficiency

Right-Size Your Workloads

Goldilocks-style view that compares CPU and memory requests against limits and actual usage for every pod. Trend arrows from VictoriaMetrics show whether consumption is stable, rising, or falling. Verdict chips flag over-provisioned and under-provisioned containers.

  • Request, limit, and actual usage side by side per container
  • Verdict chips: Over-provisioned, Under-provisioned, Well-tuned
  • Trend arrows: rising ↑, stable →, falling ↓ (requires VictoriaMetrics)
  • Sortable by waste ratio — find the biggest over-allocations first
  • CSV export for capacity planning reports
RBAC Viewer — all cluster role bindings with resolved rules and wildcard detection
RBAC Viewer — role bindings with wildcard detection
RBAC Viewer

Cluster-Wide Role Binding Audit

Lists every ClusterRoleBinding and RoleBinding in the cluster alongside the resolved rules — verbs, resources, and API groups. Dangerous bindings with wildcard verbs or resources are highlighted automatically. Useful for access reviews and incident investigations.

  • All ClusterRoleBindings and RoleBindings in one table
  • Resolved rules: shows actual verbs and resources, not just role names
  • Wildcard detection: * verbs and * resources are flagged
  • Filter by subject, namespace, or role name
  • Expandable rows show the full rule set per binding
Certificate Tracker — TLS secrets with expiry countdown and status badges
Certificate Tracker — expiry countdown and status badges
Certificate Tracker

TLS Expiry at a Glance

Scans every TLS-type Secret in the cluster and parses it with crypto/x509. Shows common name, SANs, issuer, not-before, not-after, and days remaining — with colour-coded status badges. No cert-manager required; this works on any TLS secret.

  • Parses all kubernetes.io/tls secrets cluster-wide
  • Status badges: Valid (green), Expiring Soon (amber, <30 days), Expired (red)
  • Shows CN, SANs, issuer, validity window, and days remaining
  • Sortable by expiry date — find the nearest expiry first
  • Works independently of cert-manager (no CRDs required)
Event Timeline — live event feed with time-bucket grouping and warning highlight
Event Timeline — live feed with time-bucket grouping
Event Timeline

Live Cluster Event Feed

Streams cluster events every 5 seconds and groups them into time buckets. Warning events are highlighted separately from normal events. Useful for watching a rolling deployment, debugging a failing pod, or understanding what happened in the last few minutes on a cluster.

  • Live refresh every 5 seconds — no stale cached data
  • Events grouped into time buckets (last 1 min, 5 min, 15 min, etc.)
  • Warning events highlighted with amber styling
  • Filter to warnings-only with a single toggle
  • Shows namespace, involved object, reason, message, and count
  • Respects the global auto-refresh interval from Settings
Registry Manager — image pull secrets cross-referenced with pod imagePullSecrets
Registry Manager — pull secret audit
Registry Manager

Image Pull Secret Audit

Cross-references every kubernetes.io/dockerconfigjson secret in the cluster against the imagePullSecrets references in pod specs. Surfaces orphaned pull secrets and workloads that reference missing or misconfigured registry credentials before they cause pull failures.

  • Lists all docker registry secrets cluster-wide
  • Cross-references each secret against pod imagePullSecrets fields
  • Highlights orphaned secrets (defined but referenced by nothing)
  • Highlights missing references (pod references a secret that doesn't exist)
  • Shows which registry endpoint each credential targets
  • Useful before credential rotations to map the blast radius
Cluster Shell — interactive xterm.js terminal for pod exec
Cluster Shell — full interactive terminal via xterm.js
Cluster Shell

Browser-Based Terminal

A full interactive terminal powered by xterm.js. Exec into any running pod directly from the browser — no local kubectl, no port-forward, no VPN. The session runs through the dashboard's API server using the logged-in user's JWT, so RBAC applies in full.

  • Full interactive terminal: tab completion, arrow keys, ANSI colours
  • Shell selection: bash, sh, or custom entrypoint
  • Exec into any container in a multi-container pod
  • Session uses the logged-in user's JWT — RBAC enforced end-to-end
  • Available from any pod detail page via the terminal icon
  • WebSocket transport — stays open across long-running operations

Ready to deploy?

Five pods. One kubectl apply. No operators, no Helm, no SaaS accounts.